Maricopa AZ Real Estate Market Report
Real Broker LLC · Licensed in Arizona
Updated June 2026
By James Sanson, REALTOR®. Licensed Arizona real estate agent since August 2002. Maricopa specialist since 2004. 1,000+ closings. See our Maricopa market history since 2004.
Published May 18, 2026 / Updated May 18, 2026
Quick answer
As of late April 2026, the median list price in Maricopa, AZ, is $333,500, the median days on market is 117, and 54 percent of active listings have already taken at least one price reduction, averaging $26,000. Active resale inventory sits around 333 homes across both zip codes, putting months of supply at 4.1, up from 3.6 the prior week. The market split: homes priced correctly sell in a median of 32 days; homes priced incorrectly sit an average of 109 days. This is a buyer-leverage market that rewards realistic seller pricing. Updated regularly. Call 520-838-8037 for subdivision-specific data.
On this page
- The headline numbers right now
- The Maricopa market split: 32 days vs 109 days
- 85138 vs 85139 in the current market
- How new construction is affecting resale pricing
- What this market means for Maricopa sellers
- What this market means for Maricopa buyers
- How the Maricopa market got here: 2022 to 2026
- What to watch for next quarter
This page tracks the City of Maricopa, AZ real estate market across both zip codes (85138 and 85139) using current MLS data. Numbers update periodically, with the publication date and update date shown in the byline above. Subdivision-specific data is available on each neighborhood page and by phone at 520-838-8037.
This is informational. It is not investment advice. Real estate decisions depend on personal factors beyond market data (such as timing, financing, family situation, and equity position). On timing specifically, see the best time of year to sell in Maricopa. For your specific situation, talk to a licensed real estate agent (us if you are in Maricopa) and a financial professional.
The headline numbers right now
The Maricopa real estate market as of late April 2026:
- Median list price: $333,500 across both zip codes. Down meaningfully from the 2022 peak, roughly flat over the last quarter.
- Median days on market: 117. Substantially longer than the 60 to 70 day medians of two years ago. Comparable to or longer than the broader Phoenix metro (around 52 days), which is unusual.
- Active inventory: approximately 333 homes across resale listings in both zip codes, plus active builder phases in Glennwilde, Senita, Tortosa, and Homestead.
- Months of supply: 4.1, up from 3.6 the prior week. Anything above 6 is considered a buyer's market; anything under 3 is a seller's market. We are in balanced-to-buyer territory.
- Listings with at least one price reduction: 54 percent. The majority of the active market is chasing the price down.
- Average reduction on price-cut listings: $26,000. Mispricing the day-one list price has a real, measurable cost in this market.
- Median sale-to-list ratio (when homes sell): approximately 97 to 99 percent. Buyers are negotiating 1 to 3 percent off, plus closing-cost concessions, and rate buy-downs are increasingly common.
The Maricopa market split: 32 days vs 109 days
The single most useful framing of the current Maricopa market is not the overall median, but the split between selling homes and sitting homes.
- Homes that sell are closing in a median of 32 days. These are homes priced at or slightly below the most recent same-floor-plan close in the subdivision, with professional photography, easy access for showings, and realistic seller expectations.
- Homes that do not sell sit an average of 109 days before they either pull the listing or take an average $26,000 price reduction. These are commonly priced above the recent comp set, photographed poorly, or restricted on showings.
The implication is that the market is not "slow" in the sense most sellers fear. Well-presented Maricopa homes still move quickly. The 117-day overall median is pulled up by the 54 percent of listings that are mispriced. The single most important decision in any Maricopa transaction right now is the day-one list price.
85138 vs 85139 in the current market
The two Maricopa zip codes have meaningfully different dynamics. Generalizations apply to most of each subdivision, but not to every one.
85138 (eastern Maricopa)
- Includes Rancho El Dorado, Province (55+), Senita, Glennwilde, Homestead, Tortosa, Smith Farms, Palo Brea, and Sorrento.
- Generally, a higher median price point is driven by golf course access, established master-planned amenities, and 55+ Province pricing.
- Days on market commonly track the city median, or are slightly below it.
- Province 55+ sub-market has its own dynamics tied to the active adult demographic.
- See the 85138 real estate page for zip-specific details.
85139 (western Maricopa)
- Includes Maricopa Meadows, Cobblestone Farms, Alterra, Acacia Crossings, Amarillo Creek, and Moonlight.
- Generally, more entry- to mid-tier price points, with strong family-buyer demand.
- Active new-construction phases (Glennwilde, Tortosa, Homestead) increase competition for resale inventory.
- Days on market vary more depending on subdivision and proximity to new construction.
- See the 85139 real estate page for zip-specific details.
How new construction is affecting resale pricing
One of the defining features of the current Maricopa market is the volume of active new construction. Builders are competing directly with resale sellers for the same buyer pool, and they have tools that resale sellers lack.
- Builder closing-cost incentives typically range from $5,000 to $25,000. Resale sellers cannot match this dollar-for-dollar without taking a price cut of the same magnitude.
- Rate buy-downs. Builders pay points to reduce buyer mortgage rates, sometimes for the first 1 to 3 years, sometimes permanently. This is a real monthly payment differential that resale sellers cannot easily replicate.
- Design-center credits. Buyer customization that resale sellers cannot offer.
- Builder warranties. 1-2-10 warranty packages (workmanship, systems, structural) provide buyer peace of mind that resale homes do not.
The implication for resale sellers in subdivisions with active builder phases (Glennwilde, Senita, Tortosa, Homestead): you are not just competing with other resale homes. You are competing with brand-new homes at similar price points plus incentives. Pricing has to account for this. The new construction page covers the builder-side mechanics in detail.
That is why pricing has to read the resale comps and the builder competition together: see pricing to the comps and the new builds.
What this market means for Maricopa sellers
Three takeaways for anyone listing a Maricopa home in this market:
- Day-one pricing accuracy is the single most consequential decision. With 54 percent of listings in price-reduction territory and the average reduction at $26,000, mispricing has a quantifiable cost. The 32-day sale window only opens for homes priced at or near recent comps from day one.
- Marketing investment pays back. Professional photography, Zillow Showcase placement, and easy access to showings are not optional in a 4.1-month-supply market. The cost of getting these right is dwarfed by the cost of an extra 60+ days on market and a $20,000+ eventual reduction.
- Concessions are the new normal. Closing costs, rate buydowns, and inspection-driven repair credits are common in current Maricopa contracts. Sellers who refuse all concessions on the basis of "the market should pay me list" are commonly the same sellers who end up reducing list later. Concessions are a more efficient negotiation tool than chasing down the price.
If you are thinking about selling, the Maricopa listing agent page covers the full listing process, and the Maricopa home value page covers how to get a real CMA on your specific property.
What this market means for Maricopa buyers
Three takeaways for anyone buying a Maricopa home in this market:
- You have leverage you did not have 18 months ago. 4.1 months of supply, 54 percent of listings already reduced, and longer days on market all favor buyers. Most accepted Maricopa offers are coming in 1 to 5 percent below ask with concessions on top.
- Builder competition is real and worth using. Resale sellers commonly accept terms they would have rejected a year ago because builders are offering buyers attractive packages. If you are open to either resale or new construction, considering both gives you leverage in negotiations.
- Time to do real due diligence. Homes are sitting long enough that you can tour, sleep on it, do a second walk-through, and order an inspection without a 24-hour offer deadline pressing you. The pandemic-era "decide in two hours" market is over. Use the time.
If you are buying, the Maricopa buyer agent page details our buyer representation. For first-time buyers specifically, see the first-time homebuyer guide in Maricopa.
How the Maricopa market got here: 2022 to 2026
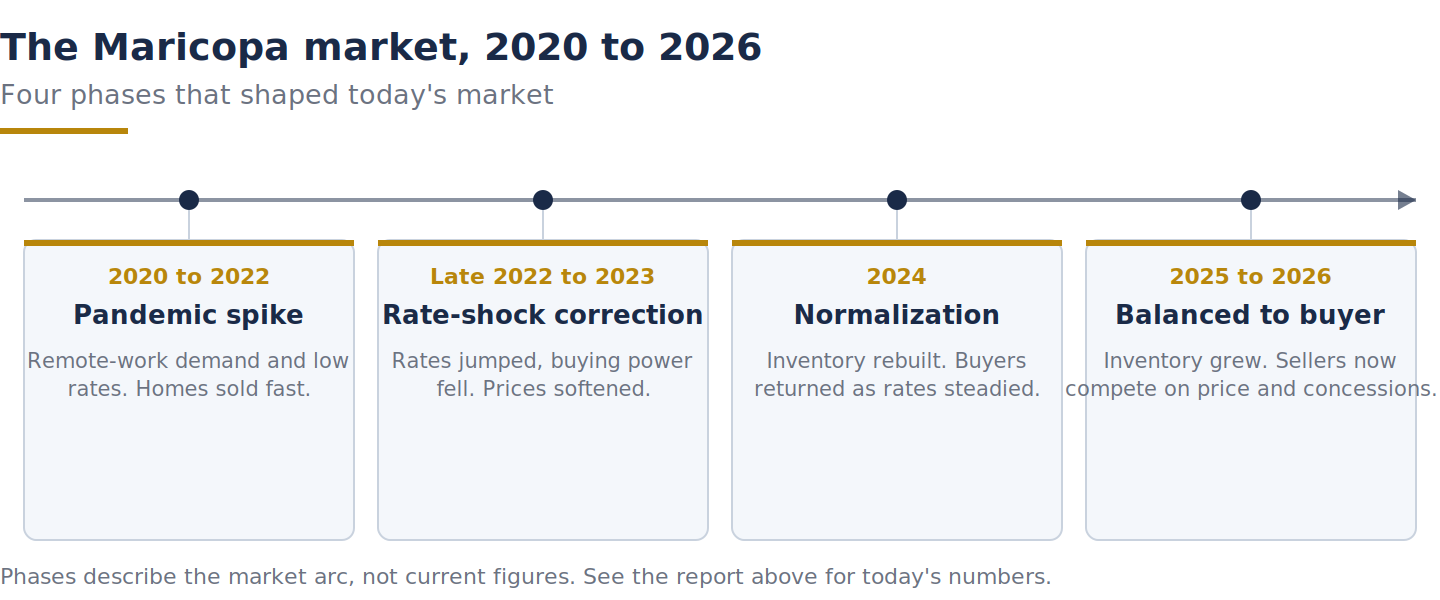
Maricopa moved through four phases since 2020: a pandemic spike, a rate-shock correction, normalization, and today's balanced-to-buyer market. See the report above for current figures. Call 520-838-8037 to talk it through.
Context for the current numbers, summarized briefly:
- 2020 to 2022: pandemic spike. Maricopa benefited from remote-work migration and low mortgage rates. Median prices climbed sharply. Days on market dropped to single digits in some months. Multiple-offer situations were routine.
- Late 2022 to 2023: rate-shock correction. Mortgage rates climbing from sub-3 percent to 6-7+ percent removed a substantial portion of buyer purchasing power. Maricopa prices softened from the peak. Days on market started lengthening.
- 2024: normalization. Inventory began rebuilding as homeowners who had locked in low rates stayed put, but new construction continued at a steady pace. Buyers slowly returned as the rate environment stabilized.
- 2025 to 2026: balanced-to-buyer market. Inventory continued to grow, days on market lengthened to the current 117-day median, and sellers began competing on price and concessions. The current market is closer to historical norms than to the 2020 to 2022 anomaly.
For homeowners who bought in the 2020 to 2022 peak, the equity position depends heavily on when in that window the purchase was made and how much was financed. Homeowners who bought before 2020 still commonly have substantial equity, even after the recent softening.
What to watch for next quarter
Three indicators worth tracking over the next 90 days:
- Mortgage rate direction. The single most important variable for a buyer's purchasing power. Any meaningful rate decrease commonly produces a measurable bump in demand within 30 to 60 days.
- Builder incentive levels. When builders pull back incentives, they have absorbed enough sales for the quarter. When they increase incentives, they have inventory pressure. This is a real-time signal about new-construction demand.
- Price reduction velocity. The pace at which active listings take their first reduction is a leading indicator. Faster reductions = more pricing discipline expected of new listings.
This page is updated periodically as Maricopa market conditions shift. The byline at the top shows the publication and update dates. If you want subdivision-specific data or a real-time read on a particular street, call 520-838-8037, and we will pull current MLS data live on the phone.
For your specific situation in the current Maricopa, AZ market, call 520-838-8037 to talk with the James Sanson Team. We will give you a real read on your subdivision, your floor plan, and your timing, with the specific numbers behind every recommendation.
Get matched with the right Maricopa specialist in 60 seconds
Tell us about your situation. We will connect you with whichever team member fits best. No pressure, no spam, just real help.
Frequently asked questions
What is the median home price in Maricopa AZ right now?
Is the Maricopa AZ housing market crashing?
How long does it take to sell a home in Maricopa AZ in 2026?
Is now a good time to buy a home in Maricopa AZ?
Are home prices going up or down in Maricopa AZ?
How many homes are for sale in Maricopa AZ right now?
How does the Maricopa market compare to Phoenix metro?
How often is this market report updated?
Talk to a Maricopa specialist today
Whether you're buying, selling, or just exploring, call us. No obligation.
520-838-8037James Sanson | Real Broker LLC | Licensed in Arizona
Ready to talk? Get matched with a Maricopa real estate agent today
Call 520-838-8037 right now, or fill out the form and we will reach out within one business day.